-
 H. A. Dodd (He/him)'s profile was updated
 -
Introduction to Data Visualization - Spring 2023 - Hamp Dodd
Books as Contraband: A Look into the Banning of Literature in United States PrisonsAs I began to conceive of a proposal for this project, my recent reading of Bernard Stiegler’s Acting Out (specifically his essay How I Became A Philosopher) was at the forefront of my mind. In this text, Stiegler details his academic evolution during a 5-year period of incarceration for armed robbery in Toulouse, France, in which he entered as a high-school dropout and emerged as a student of philosophical powerhouses such as Jacques Derrida, going on to achieve his doctorate under Derrida’s guidance at the University of Toulouse-Jean Jaurès and eventually becoming the author of 30 published texts. With the uptick of “book bans” occurring in schools across the country, this project’s initial aim was to explore the impact of such hysteria as it inevitably influences the lives of those most ignored in society (i.e. prisoners), as well as to consider the implications of such strictures on flows of information and how they might hinder the restorative transformations that are possible for the incarcerated through education and access. As my project developed, these questions did not necessarily change. However, with the aim of prison book bans revealed to be largely targeting inmate’s desire (in the form of prohibitions on texts with sexually explicit material) rather than their capacity for political or philosophical thought, what was revealed through this application of The Marshall Project’s dataset was not what my initial query had anticipated. As noted in my proposal, the audience for these visualizations is anyone concerned with or interested in prisoners’ rights, rehabilitative incarceration, or the general advancement of broader access to education, literacy, and reading materials for all, imprisoned or otherwise. However, considering the unbalanced focus of prisons on banning anything regarded as sexually “inappropriate,” the audience of these implications could be extended to those interested in the imposition of morality via the state and the biopolitical regulation of sexual desire. Given that these are materials provided to incarcerated individuals whose offenses are not present in the dataset, this conversation is difficult to have and thus, this project’s purpose is not to argue for and against the ban of sexually explicit books. What these visualizations aim to do is encourage the audience to consider the political, religious, and moral motivations inherent in these bans and the reasons why proscriptions on “explicit nudity” outweigh bans on texts depicting violence by such a sizable margin. My first visualization provides a simple view of the trajectory of book bans in the United States over the last 20+ years. Notable is the uptick in book bans around periods of political divisiveness and moral panic, such as in the case of Bill Clinton’s impeachment in 1998, Obama’s re-election in 2012, and the civil delirium that led up to the 2016 election of Donald Trump. As can be seen, since the election of Joe Biden in 2020, book bans in prisons have soared to new heights. This is not to imply direct causal relations but I do find it fascinating that the (presumably) conservation imperative to ban sexually explicit material escalates whenever right-wing power is left to the uncertainty of an election (or, in response to losing one). My second visualization simply works to highlight the foremost reasons why books are being banned in the United States. As one can see, “Sexually Explicit Content” and “Explicit Nudity” have been listed as the cause for 2,300 books being banned, with the vague “Security Risk” following behind. Even as one looks down the list, categories such as “Obscene Material” and “Erotica” are also related to the prison industrial complex’s obsession with outlawing anything deemed to be sexually illicit. My third visualization provides the audience with a list of “most notorious authors,” many of which I was unfamiliar with prior to developing this project. Unsurprisingly, many are authors of what has been labeled online as “erotica” or “urban erotica,” while others such as Stephen King and Neil Gaiman seem entirely arbitrary. While texts from Marxists and radicals such as Cedric Robinson are predictably banned in Florida, the attention paid to political or philosophical texts is almost nonexistent. This is certainly something of a positive, however, it can also be said to be indicative of the lack of interest paid to such literature by incarcerated individuals. My final visualization is a simple map depicting the states from which this dataset is produced. As is evident, Florida, Texas, and Missouri are the principal figures in this movement, with Florida boasting over 20,000 banned texts. My approach to this project was largely rooted in and directed by what could be done with the limited nature of this dataset. While the scope of the data is extensive (comprised of more than 50,000 titles), the information therein is inconsistent, sloppy, and at times, missing entirely. For example, while states such as Florida list the precise reasons why texts were banned (e.g., violence, sexually explicit), many states simply provide an opaque code (such as A1, F2, etc.) that has no referent to be found online. For states such as Arizona, the reason is simply excluded altogether. This inconsistency within the dataset and the different methodologies of reportage by different states limits the effectual nature and potential of applying this data. With that said, my temporal line graph is meant to communicate the degree to which this prohibition mentality has proliferated in recent years. As noted, these bans have only been trending upward as the American political landscape becomes more divided, ideological, and absurd. The bar graphs used to visualize both the authors targeted by book bans and the reasons employed to justify that bans were chosen simply due to their effective and concise means of communicating that which I found important in producing this narrative. And lastly, the map, incomplete as it is, is a useful tool for conveying counts of the total number of books banned throughout the country. The future of this project, or any similar project attempting to compile and communicate the extent of book prohibitions occurring in prisons in the United States, would be to complete the dataset, however difficult that this might be. Though these visualizations are highly useful samples of what is occurring throughout the country, a comprehensive understanding of this phenomenon will not be possible until data from each state is gathered. Additionally, my initial aim of interweaving the story of Bernard Stiegler’s redemption arc was a bit short-circuited by the sheer degree to which these bans focus on restricting the prison population’s exposure to anything sexual in nature. My original assumption was that books deemed “dangerous” by the state would be those capable of producing a Bernard Stiegler or an Antonio Gramsci, of spitting out a political or philosophical thinker due to the simple combination of years of isolation + volumes of radical thought. This was not the case and, in some way, it is disheartening. Comic books and pornography are considered more threatening to the state than political manifestos or philosophical polemics and I am not sure what to make of this. Perhaps the future of this project could be a more thorough critical investigation of the underlying motivations behind these bans as well as the educational programs and pathways present in the prison system. Admittedly, my knowledge of this subject matter is limited and I am sure that there are conclusions to be made from this data that are lost on me. However, going forward, I think an expanded scope of data and the addition of broader historical and social context, coupled with a more thorough and conclusive critical analysis grounded in a greater understanding of the prison-industrial complex, would all be necessary components in the production of a more impactful […] “Books as Contraband: A Look into the Banning of Literature in United States Prisons”
-
Introduction to Data Visualization - Spring 2023 - Hamp Dodd
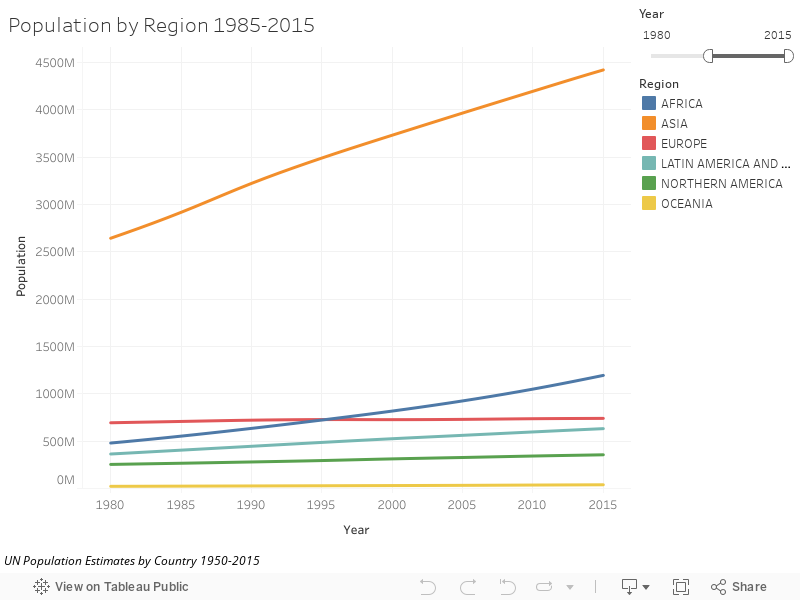
A Bookshelf & its BiasesThe inceptive question at the core of this series of visualizations is a simple one that comes with an answer attached: Are my bookshelves (i.e. the material I’ve chosen to procure, curate, and consume) biased politically, temporally, geographically, or otherwise? Predictably, the response to this query, be it answered regarding my bookshelf or anyone else’s, is “yes, of course.” However, what my inquiry is intended to illuminate is the degree to which my book collection reinforces my preexisting politics or weltanschauung rather than challenging my biases or providing a broader scope of insight, experience, etc. While quantifying evidence of my biased procurement of texts is anything but shocking, it is a necessary and sobering reminder that “filter bubbles” don’t purely exist as automated algorithmic processes driving one’s digital behavior; they are equally a product of our creation through our elected patterns of consumption (e.g., there are 147 blatantly leftist books that I’ve purchased in my dataset – what is this if not hypocritical over-indulgence in my own politics via engagement with an economic framework that such texts are critical of?). Ultimately, these visualizations are less about illustrating that which could already be assumed (i.e., “my books represent bias”) and more about producing a model of analysis that explicates these acknowledged biases and their, at times, inconspicuous reinforcement via the seemingly “bias-destroying” pedagogical practice that is expansive reading and library-building. For these reasons, the intended audience for these visualizations is anyone with a bookshelf. Language is inherently political and should be critically considered as such. The commodity fetishization of a text, as tends to be our default relationship to a book, disregards its connection to the historical material conditions that produced it and the ideology at work therein. Ideally, analytical practices such as that which this project aims to at least scratch the surface of will work to encourage the considered examination of one’s personal library and the self-concocted filter bubble that might exist in one’s color-coordinated collection of Crown Publishing Group celebrity politician memoirs or in a Funko-Pop bespeckled shelf showcasing each of Brandon Sanderson’s six-hundred books. In what follows, I’ll provide a brief explanation of each data visualization:Number of Books on Shelf by Country: This spatial representation plots each of the 417 books in my data set on a world map to illustrate the limited geography that my book collection covers. This is intended to demonstrate the “gaps” in my collection.Number of Books on Shelf by Original Language: Similar to the map, this treemap is intended to highlight the anglo-centrism of my bookshelf and the potential for bias that such an unevenness of experience and world-view might present.Number of Books on Shelf by Genre: This is a simple breakdown of my bookshelves by reductive genres. The intent of this (and its positioning early in my visualization story) is to give a brief overview of my bookshelf by subject.Books on Shelf by Year of Publication: This area chart is meant to showcase the temporal biases inherent in my collection. As one can see, the majority of my books come from the post-war period, confining my exposure to experiences temporally located within the last 70 or so years.Political Affiliation of Authors on Bookshelf: Another simple breakdown of my bookshelves by the reductive political affiliation of the authors present. While my initial aim was to include more diverse categories of political thought, I found that reducing the dataset to a primarily right vs. left binary allowed for easier, cleaner data visualization.Political Affiliation of Authors by Genre: The aim of this visualization is to locate which genres are comprised of the most outwardly political authors. For example, the substantial difference in my reading of leftist accounts of history from that of my collection of right-leaning historical authors paints a clear picture of how my understanding of certain histories might be overwhelmingly colored by leftist ideologies and interpretations.Political Affiliation of Most Prominent Authors on Bookshelf: This visualization simply showcases the most prominent authors on my bookshelves (by number of books) and their politics. One’s number of books per author is generally an indicator of one’s most revered writers so it could be assumed that the political biases represented hierarchically here are representative of one’s worldview, values, etc.Political Affiliation of Books by Means of Procurement: Through this project, I became interested in the way in which I come to own books, especially because I’ve had such strange luck finding books I want on stoops and sidewalks. It is notable that in both the “Found” and “Purchased” categories leftist texts are overwhelmingly prevalent while the politics of the selection of books I’ve been gifted are more ambiguous.Political Affiliation of Books Published by Most Prominent Publication Companies on Bookshelf: This visualization is meant to indicate the potential biases of publishing companies. However, seeing as I am the one curating what I purchased from each company, this information is likely not indicative of anything other than my purchasing habits.Political Affiliations by Genre: This stacked bar visualization is meant to further reveal where the biases of my collection exist by genre. For example, the breakdown of the political philosophy genre highlights an absurd degree of bias toward leftist political thought. The production of the dataset behind each of these visualizations was a laborious process of incessant Googling and micro-decision-making. Unlike our present moment of hyper-politicization in which anyone’s ideology can be easily located in a Twitter bio, authors active prior to the Digital Age (outside of genres such as philosophy) have been less forthcoming with their dogmas, opting instead for allowing their beliefs, at times complex and irreducible to a reductive political binary, to subtly shine through the stories they tell (novel, huh?). However, this lost art of nuance is not conducive to easily deducing an author’s politics in the production of a reductive dataset, thus requiring me to define many of the figures listed in my data as politically “Unknown.” Using “It’s Complicated” to fill in the gaps and represent thinkers whose politics either shifted or never settled throughout their lives, I attempted to cover as much territory as possible with what ultimately amounts to a simplistic right vs. left analysis. My decision to include the “Means of Procurement” was largely rooted in my desire to understand the way in which I engage with the market in the acquisition of my assemblage of personal propaganda. As noted, many of my books have come from circumstantial discovery on the street and I found the notion that New York City exists still as a “filter bubble” despite the chance-discovery of free texts to be interesting and worthy of exploration. Certain information still lingers in this dataset unused, such as page counts and condition of the text upon procurement (used vs. new), offering the potential of expanded analysis. However, to provide answers to the base question regarding bias, I didn’t feel as if these columns of data offered anything wildly illuminating. In the future, I’d like to extend this dataset to include sub-genres of texts and more thorough information about each author. The most noticeable inadequacy of this data is undeniably the reductive nature of its content, largely stemming from our finite timeframe and the limited information available when trying to restrain each time segment of research on an author to under a minute. However, if extending the dataset appears as too arduous a task, I think reducing the book count to focus on a single genre (such as philosophy) might allow for a more thorough analysis of the complexities of the political biases therein (rather than right vs. left, actual political affiliations could be quantified and considered). All in all, I think (and hope) that the expansive collection of texts represented through my data (despite their monotonality) and the critical consideration represented through clean bar graphs and geographical visualizations communicate clearly my intentions and work to stimulate further reflection regarding the texts we choose to keep and their role in the production of our subjectivity. Link to “A Bookshelf & its B […] “A Bookshelf & its Biases”
-
Introduction to Data Visualization - Spring 2023 - Hamp Dodd
Though my initial research questions regarding the pervasiveness of rodent activity in New York City were broader in scope than my familiarity with Tableau allowed me to successfully answer, through further […]
-
Introduction to Data Visualization - Spring 2023 - Hamp Dodd
Lab Zero : Tableau Public Link
-
-
Modeling Value in the Anthropocene
If we are now living in the Anthropocene, this state of fact is not sustainable: we must pass to a state of law in which negentropy becomes the criterion of every type of value, the value of values, and this is […]
-


-

-

-
H. A. Dodd (He/him)'s profile was updated
-

-
-
-

-
H. A. Dodd (He/him) became a registered member
-
-
-
-
-
Introduction to Data Visualization - Spring 2023 - Hamp Dodd
Lab Zero : Tableau Public Link
-
-
-
-
-
-
-
-
-
-
-